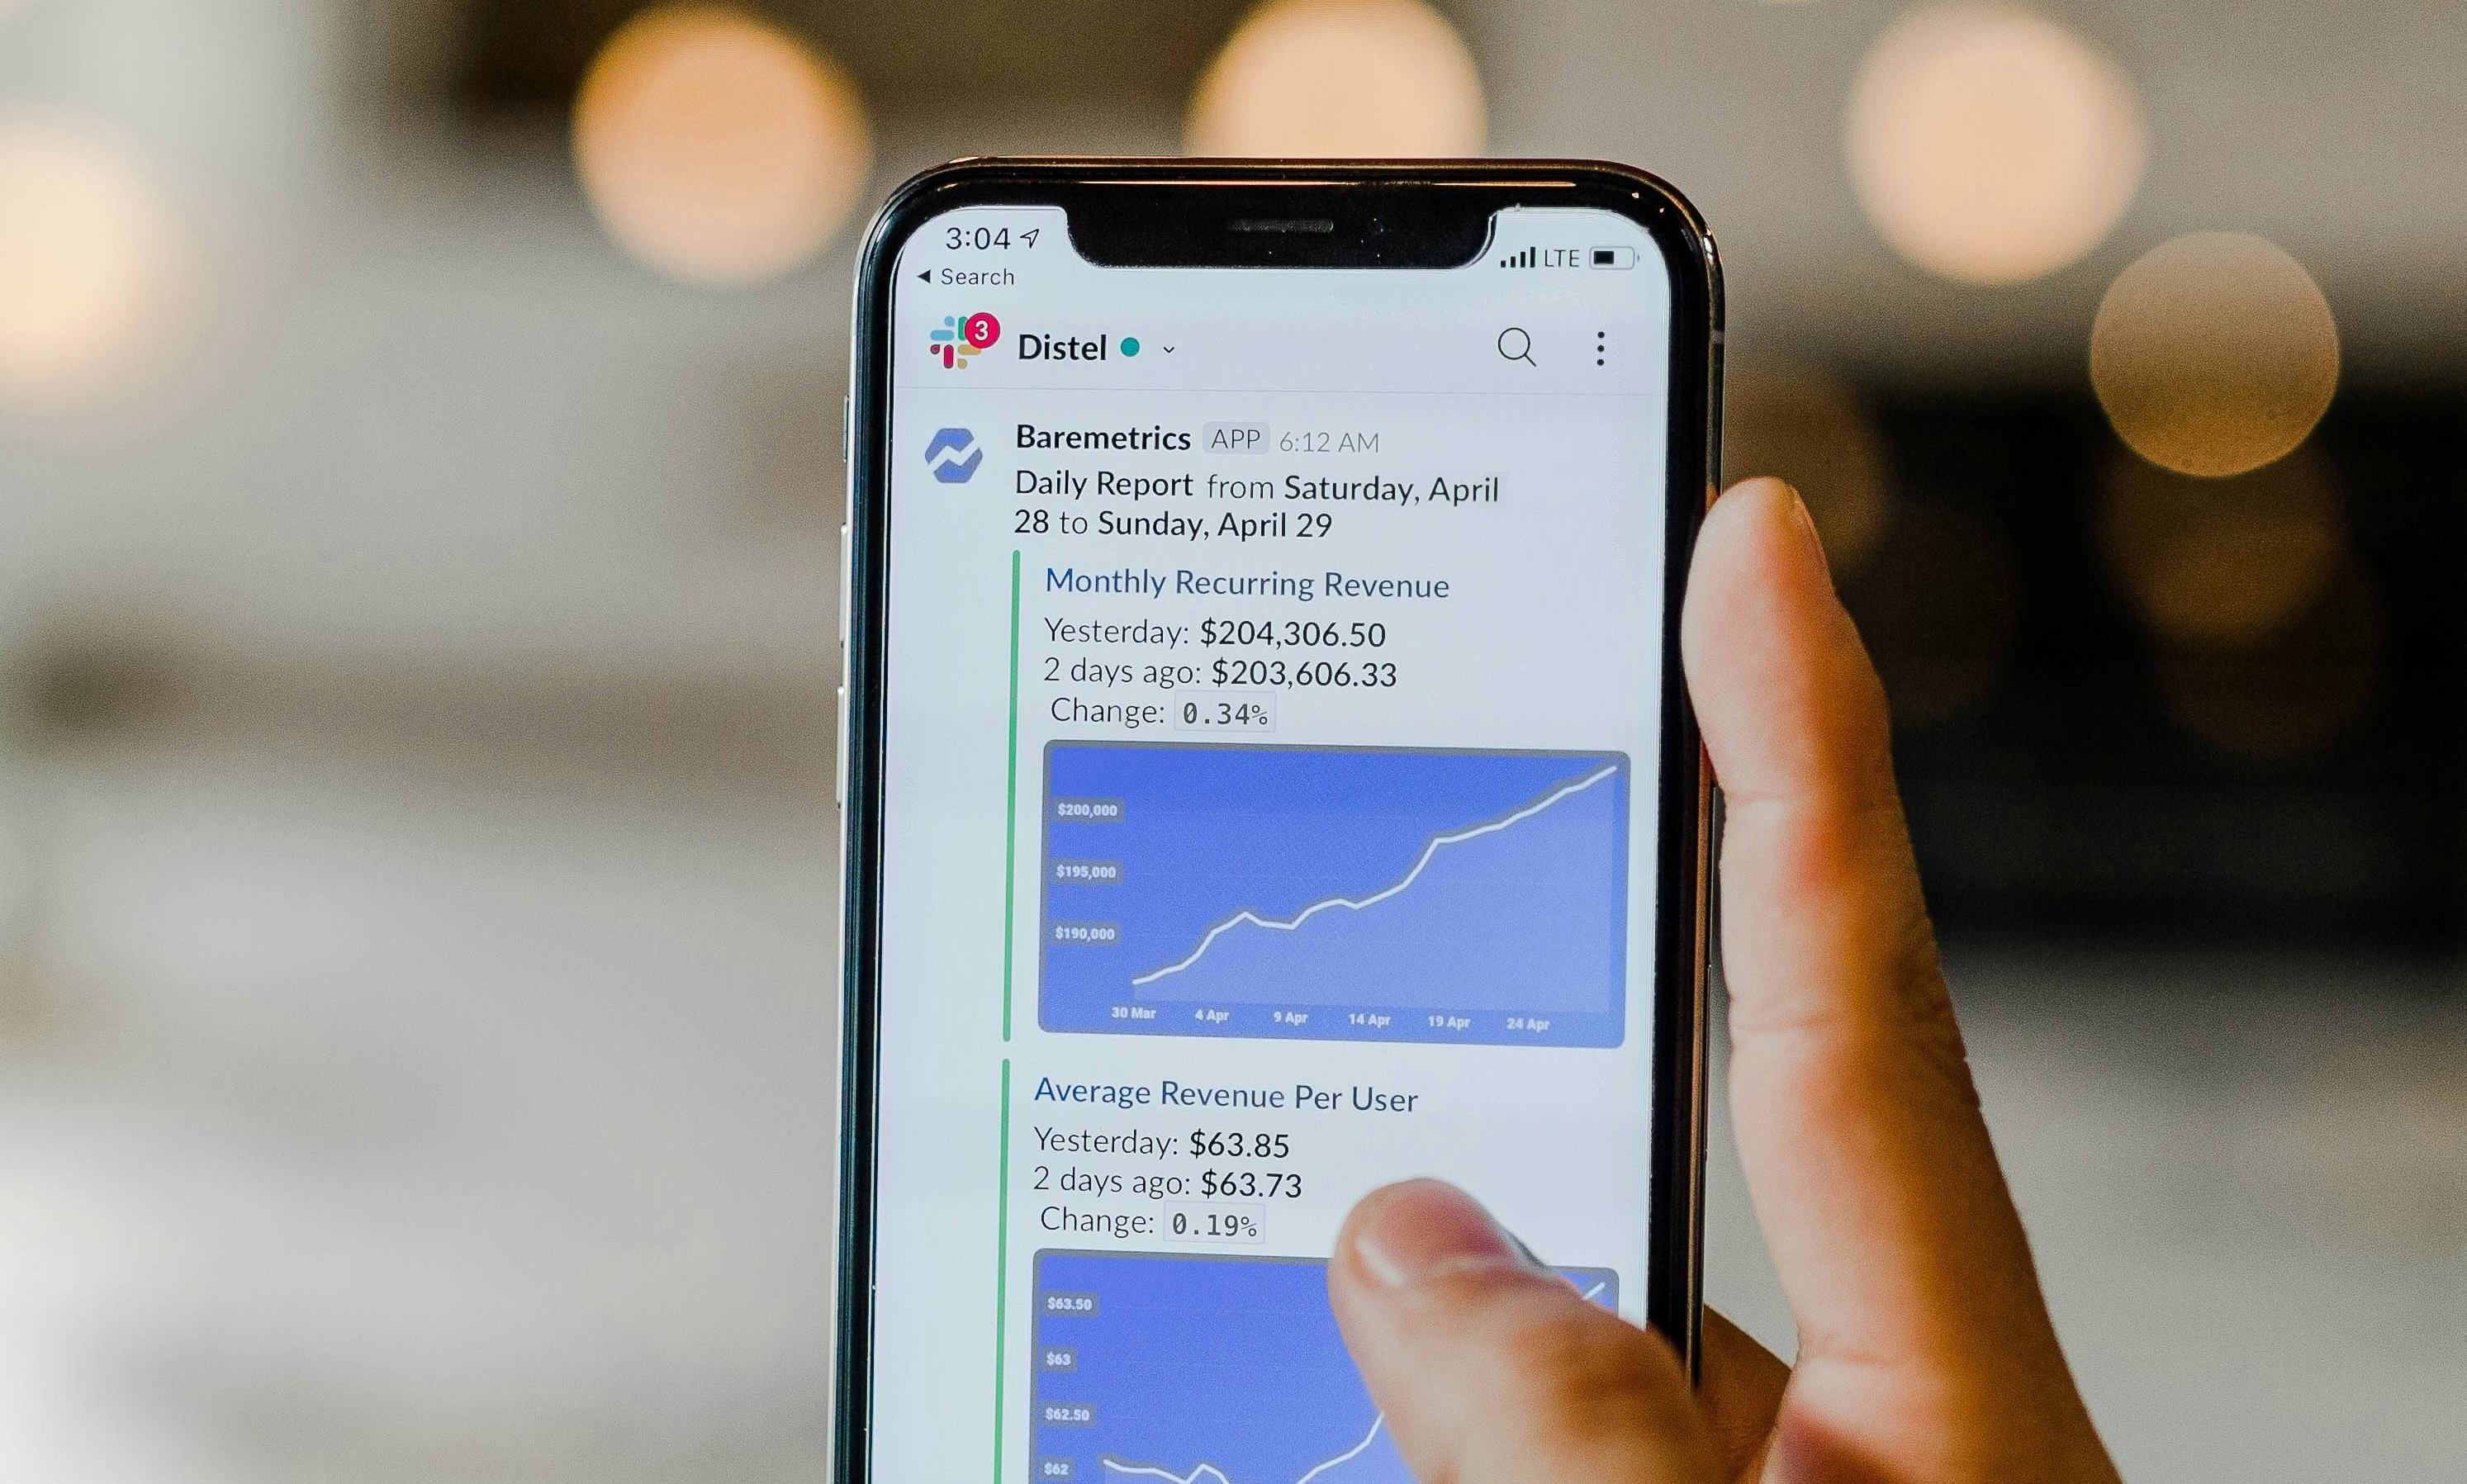
In order to 'close the feedback loop' which is your NPD strategy, your business should monitor and evaluate its performance so it can make corrections and improvements in areas of need. The last component of this framework looks at why and how you can strategically monitor your businesses performance and how to focus your valuable resources into the most important sectors of deficiency.
Success metrics are simple and easy to understand. How do you define success within your enterprise? Is it increasing your production capabilities by 10%? Or, maybe it is launch a new successful product. You can use and build upon the following template for understanding success metrics as well as the performance indicators that compliment these. An example of this coupling may be 'our R&D expenses have decreases over the last 3 months' (performance indicator) and this may be due to 'stronger team chemistry or bonding resulting in more product work internally in the company'.
Metrics | ||||
---|---|---|---|---|
Performance Indicators below (examples) | Doing the right product development | Doing product development right | Culture & Climate | Portfolio Management |
Revenue Increased 20% | Improving internal workplace operations to improve work productivity | |||
Product Catalogue Increases 10% | Generate ’n’ number of new ideas, maintain a balanced portfolio, implement roadmapping or planning tools | Understanding the market and customer well, having good | Devise strategic techniques for portfolio management, kill old projects that do not perform well | |
Increase the number of employees by 30% | Embrace a positive climate and work environment, offer strong support and training | Increase projects as revenue growth increases, invest profits back into the business |
This activity looks at the importance of information for making a decision about your business. Evaluate the information below from most to least informative. These examples will help you understand why metrics are important and why different sectors of your business should be measured.
"The last 3 months we have tracked revenue changes and noticed a 5% decline against out expected metric. There are many factors that could have impacted this, such as illness within the company, current events which effect the market or poor product portfolio management."
"Today has been good, we have sold 5 new products"
"Our production schedule is on track and we are meeting weekly production quota."
Statement 1: Most Informative
This statement provides a basic numeric evaluation of a performance indicator 'revenue'. It also offers insight into business areas that may be responsible causing this decrease in revenue.
Statement 2: Least Informative
There is minimal information here and it would be hard to evaluate how a business is performing.
Statement 3: Average Information
This statement does offer some insight into a businesses production performance, but does not use any quantitive metric to base success off, so making improvements or praising results is more difficult.
Balance is great, isn’t it? One method of measuring and evaluating your product performance is to use a balanced scorecard. What is this exactly? Well, a balanced scorecard is a tool or strategy you can use to evaluate how your business is performing relative to your businesses direction goals, portfolio targets and how execution of tasks happens within your business. It is made up of four core areas, financial, customer, internal processes and organisational capacity. Within your financial branch, metrics such as revenue or profit exist as measures of your businesses performance. However, if this measure is underperforming the likely cause will be related to a different area of your balanced scorecard. You can follow the steps below to create a balanced scorecard for your SME.
> Step 1.
Establish some metrics you want to evaluate. You can do this by thinking about what is important for your business direction or strategic alignment. Some examples may include:
> How much money is the product we launched generating in its area of the market?
> How many products are we producing each day?
> Did we meet the product-time-to-market goals originally set out for us?
> Is our market share what we expected it to be?
> Step 2.
Secondly, quantitatively measure (as best as your SME can) how well your business has performed against these criteria. Was it leading with respect to the metric being assessed? Was your business generating more revenue than expected, or was production higher than what was anticipated? These are all examples of leading metrics. Lagging metrics are the opposite, and are crucial to measure because they often provide insights into areas of your business that are not performing very well. This step is similar to preforming a root cause analysis. More information about RCA can be found under the resources section.
After doing this, you should have an understanding of you company in terms of a balanced scorecard, as well as how to find evaluate success metrics and find the root cause of any areas of your company that are underperforming.